HANA News Blog
SAP HANA Optimizer - the heart of the performance
The HANA Optimizer is one of the core components of the HANA database. It determines how SQL is executed.
A database optimizer behaves similarly to the navigation system in your car. You use various parameters to determine which route you want to take to reach a particular destination. Potential additional costs for tolls and ferries also play a role, as do other limitations such as the vehicle's height, length, and width. From these input parameters, the navigation system determines the optimal route based on current traffic information (traffic volume, construction sites, congestion, accidents, closures, etc.), weather conditions, and the length of the route. This means that with exactly identical input parameters, different routes, costs, and thus different travel times can arise depending on the given conditions.
The HANA optimizer behaves similarly. It receives its input variables from the user's selection criteria. The given conditions here are the available resources, the dimensions of the objects involved (number of entries, field lengths, column size, different column weights, etc.), index information, existing hints, existing execution plans, optimizer statistics, etc. Finally, potential costs are calculated. As with a navigation device, the goal is to determine the fastest route. This may often not be the shortest or the most resource-efficient.
If you purchase a more powerful car with modified driving characteristics, the same route can now be covered somewhat faster. If you discover a shortcut with your old car, an improvement is also possible, but without the cost of purchasing a completely new vehicle. In HANA, this corresponds to measures such as adapting the application logic or using DB hints with other engines. With this analogy, we want to demonstrate that more system resources or a new database revision are not necessarily the direct path to the actual goal. It is much more important to understand how and why the optimizer handles certain queries differently.
Sometimes there may be a traffic jam along the route, which can be quickly resolved or even prevented in the first place by a clever traffic control system (parameter and workload management). Therefore, it is important to know the system's workload and be able to react to significant deviations. We recommend defining KPIs for this purpose.
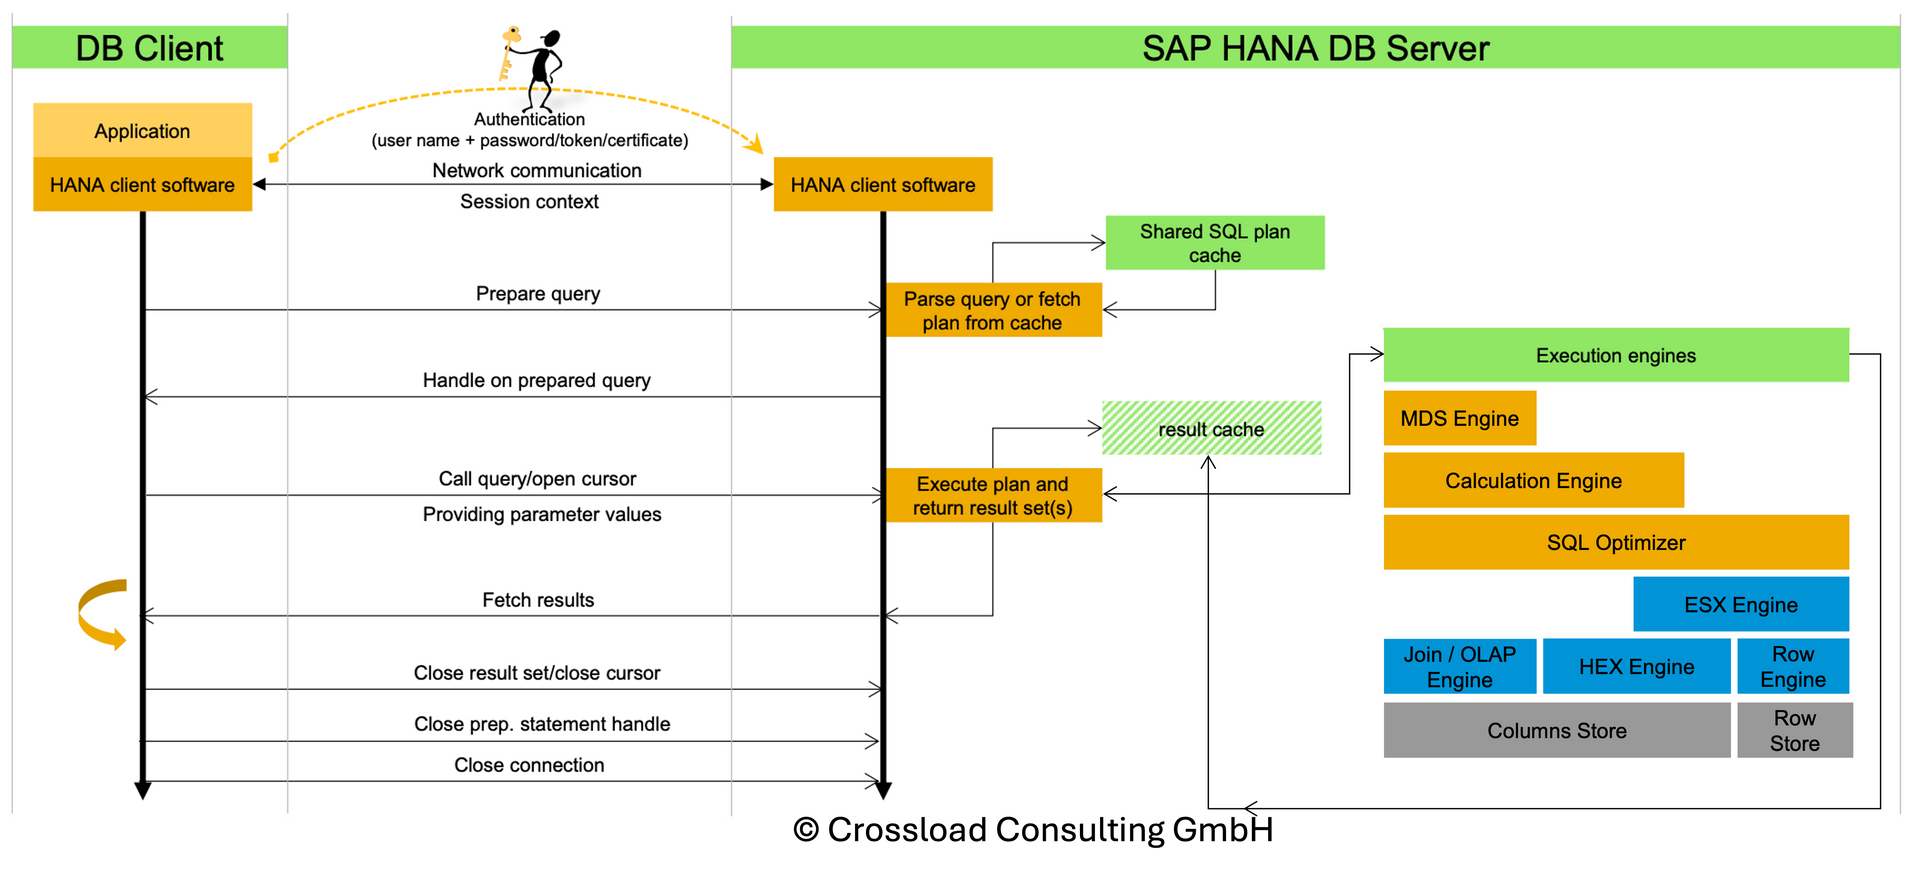
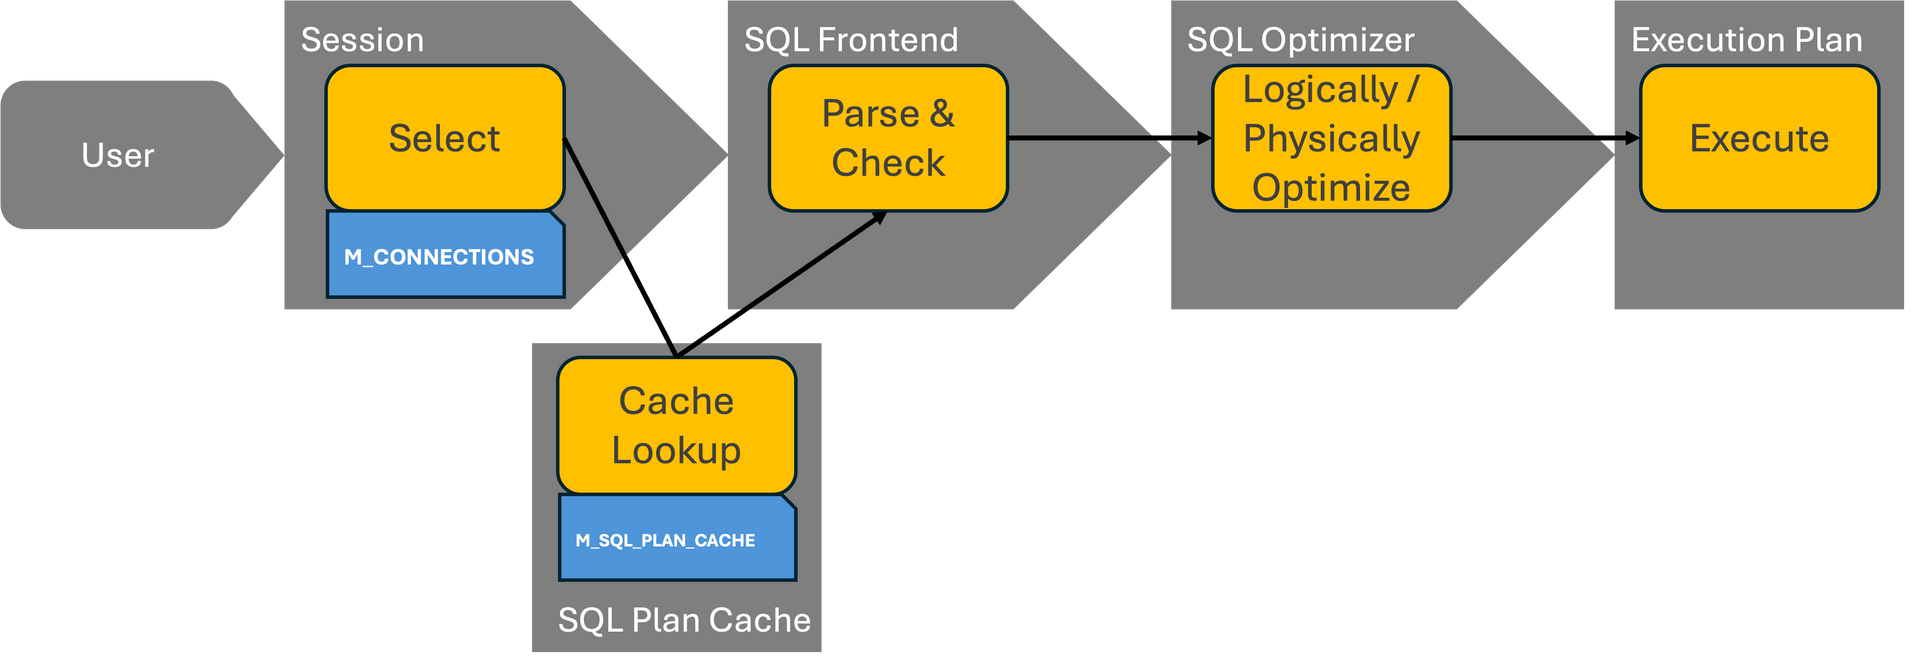
To understand exactly how the optimizer works, let's first look at the flow of an SQL processing operation. This will make it clear when it is used.
You have to know that SQL is declaritive language. This means it only describes "what" to be processed. The "how" is determined by the SQL processor. SQL Processor is smart, but needs to make decisions in very short time => the plan might be sub-optimal if too many tables are involved.
Important: It cannot fix data model or logical issue within the SQL.
Normally, the SAP HANA database consistently picks an optimal execution plan to process a database request. In some cases, though, the database can switch to a worse execution plan, resulting in higher runtimes and increased CPU or memory consumption.
Typical reasons for execution plan regressions are:
- Bind values: The selectivity of the bind values / parameters used during preparation are considered to work out an optimal execution plan. Subsequent executions to a certain keep the same execution plan even if the selectivity are significantly different. This is particularly critical in context of HEX engine (SAP Note 2570371) and SAP HANA <= 2.0 SPS 07 because the generated HEX execution plan is highly static. See SAP Note 3513868 for more details.
- Sampling: Working out a good execution plan to a certain extent depends on sampled data. For example, only a subset of partitions is sampled, so that many empty partitions should be avoided.
- Complexity and design: The more complex the design of a database request and the underlying accessed objects is, the higher is the probability of misconceptions of the query optimizer. Thus, keep the design always as light-weight and simple as possible, also in context of concepts like CDS views and AMDP procedures. Also, make sure that modelling best practices are considered.
- Data: The actual data in the underlying tables also impacts optimizer decisions. In rare cases, even small changes to the underlying table data can impact the optimizer decisions.
There are two ways to determine the statistics:
- The columns are loaded into memory and data statistics are calculated as usual
- The columns are not loaded and values are estimated
The data statistics are stored within monitoring view M_SYSTEM_DATA_STATISTICS. You can use HANA_SQL_Statistics_DataStatistics_2.00.040+ to read the most recent data. Which data you will get?
- TYPE: Data statistics type
- SCHEMA_NAME: Schema name
- TABLE_NAME: Table name
- COLUMNS: Columns (individual columns or column groups listed via comma-separated column list)
- SOURCE: SYSTEM in case of system generated, USER in case of user defined
- LAST_REFRESH: Last data statistics refresh time
- COUNT: Record count
- NUM_DISTINCT: Number of distinct values
- NUM_NULLS: Number of NULL values
- MIN_VALUE: Minimum column value
- MAX_VALUE: Maximum column value
- BUCKETS: Histogram buckets
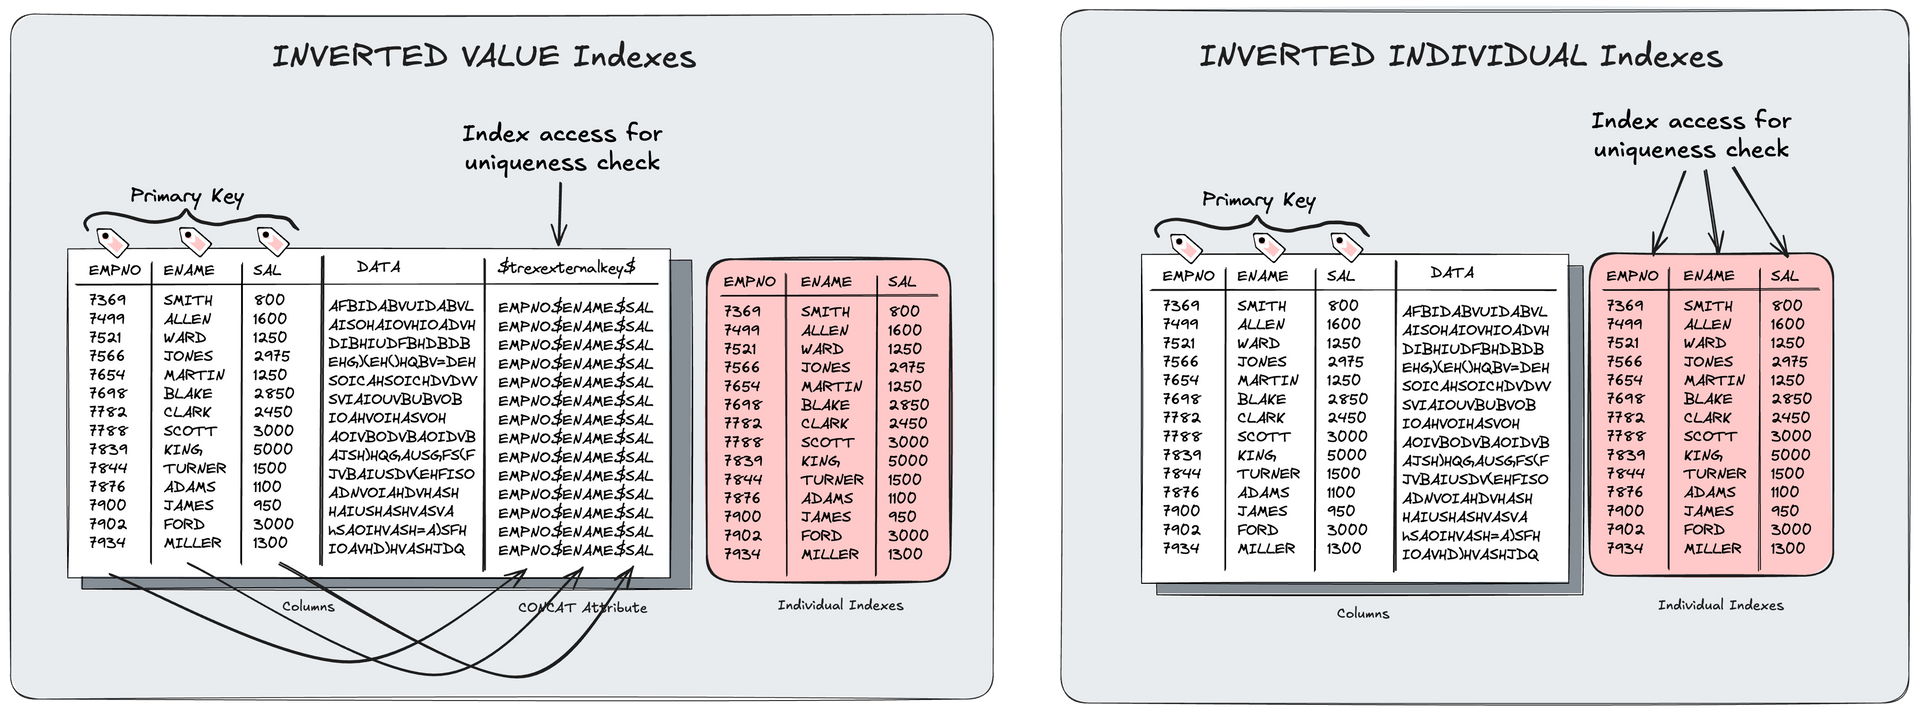
- INDIV_COSTS: Cost factor for leading column of inverted individual indexes (SAP Note 2600076)
- TOP_1: Top 1 histogram bucket (e.g. frequency and value of most frequent column value in case of frequency histograms)
- TOP_2: Top 2 histogram bucket
- TOP_3: Top 3 histogram bucket
- DATA_STATISTICS_CONTENT: Raw data statistics details in JSON format for SYSTEM statistics, statistics name for USER statistics
This data statistics are fundamental for the decisions of the optimizers. Like our example with the navigation system, if you are using old or incorrect information about the route, the system will decide possible wrong based on this wrong input variables.
But there are also other statistics. The so called join statistics available through monitoring view M_JOIN_DATA_STATISTICS. Join statistics are required to optimally understand cardinalities when joining different tables. You can use HANA_SQL_Statistics_JoinStatistics_1.00.120+ to select the details.
- REFRESH_TIME: Last statistics refresh time
- HOST: Host
- PORT: Port
- SCHEMA_NAME_1: Schema name of table 1
- TABLE_NAME_1: Table name of table 1
- COLUMN_NAME_1: Column name of table 1
- SCHEMA_NAME_2: Schema name of table 2
- TABLE_NAME_2: Table name of table 2
- COLUMN_NAME_2: Column name of table 2
- NUM_ROWS_1: Number of rows in table 1
- DISTINCT_1: Distinct values in column of table 1
- MEMORY_KB: Used memory (KB)
- VALUE_COUNTS_1: Unique value counts (or a single average value)
- VALUE_COUNTS_FREQUENCIES_1: Frequency of different value counts (or a single average value)
- MATCHING_VALUES_COUNTS: Number of value counts in table 1 with corresponding entries in table 2
indexserver.ini -> [joins] -> statistics_method (default: cs_statistics).
Setting statistics_method to "traditional" can result in increased resource consumption and additional database trace messages.
What can take influence? Which parameter can be changed to influence the behaviour?
indexserver.ini -> [joins] -> cs_statistics_cache_invalidation_threshold_factor (default: 2.0)
Table content has significantly changed since the last execution.
Definition of significance: More than 25 rows, change happens more than 2 times.
indexserver.ini -> [joins] -> cs_statistics_cache_invalidation_by_shrinking_tables (default: false)
With SAP HANA 2.0 SPS 07 (>= 2.00.073) SAP recommends to set this parameter explicitly (SAP Note 2600030). With SAP HANA >= 2.00.080 the default for this parameter is changed to false.
indexserver.ini -> [sql] -> large_predicate_sampling_threshold = <elements> (default: 100)
Predicates like long OR concatenations are only sampled when the number of elements doesn't exceed 100.
Otherwise a potentially less accurate estimation will be used and the risk of slower execution plans increases. Using larger values can result in better optimizer decisions at the cost of some parsing overhead.
You can control the limit on statement level via hint LARGE_PREDICATE_SAMPLING_THRESHOLD(<elements>)
indexserver.ini -> [hex] -> min_table_increase_factor_to_recompile = <factor> (default: 4)
The default value of 4 triggers a recompilation as soon as the table size is factor 4 larger or smaller than during the last parsing.
indexserver.ini -> [sql] -> compile_time_sampling_size (default: 1000; HANA 2.0 SPS08)
The size of sample to estimate selectivity of a filter by sampling: compile_time_sampling_size specifies the number of sample records to be examined on SQL query compilation to get statistics of a table or a partition of a table in case of partitioned table. If the value is 0, records in tables will not be examined on SQL query compilation. If the value is larger than the number of records in a table or a partition, all rows in the table or the partition will be examined.
indexserver.ini -> [sql] -> compile_time_sampling_partitions (default: 8)
Maximum number of partitions to estimate selectivity of a filter by sampling: compile_time_sampling_partitions specifies the maximum number of partitions to be examined on SQL query compilation to get statistics of a partitioned table. If the value is 0 or larger than the number of partitions in a table, all partitions in the table will be examined.
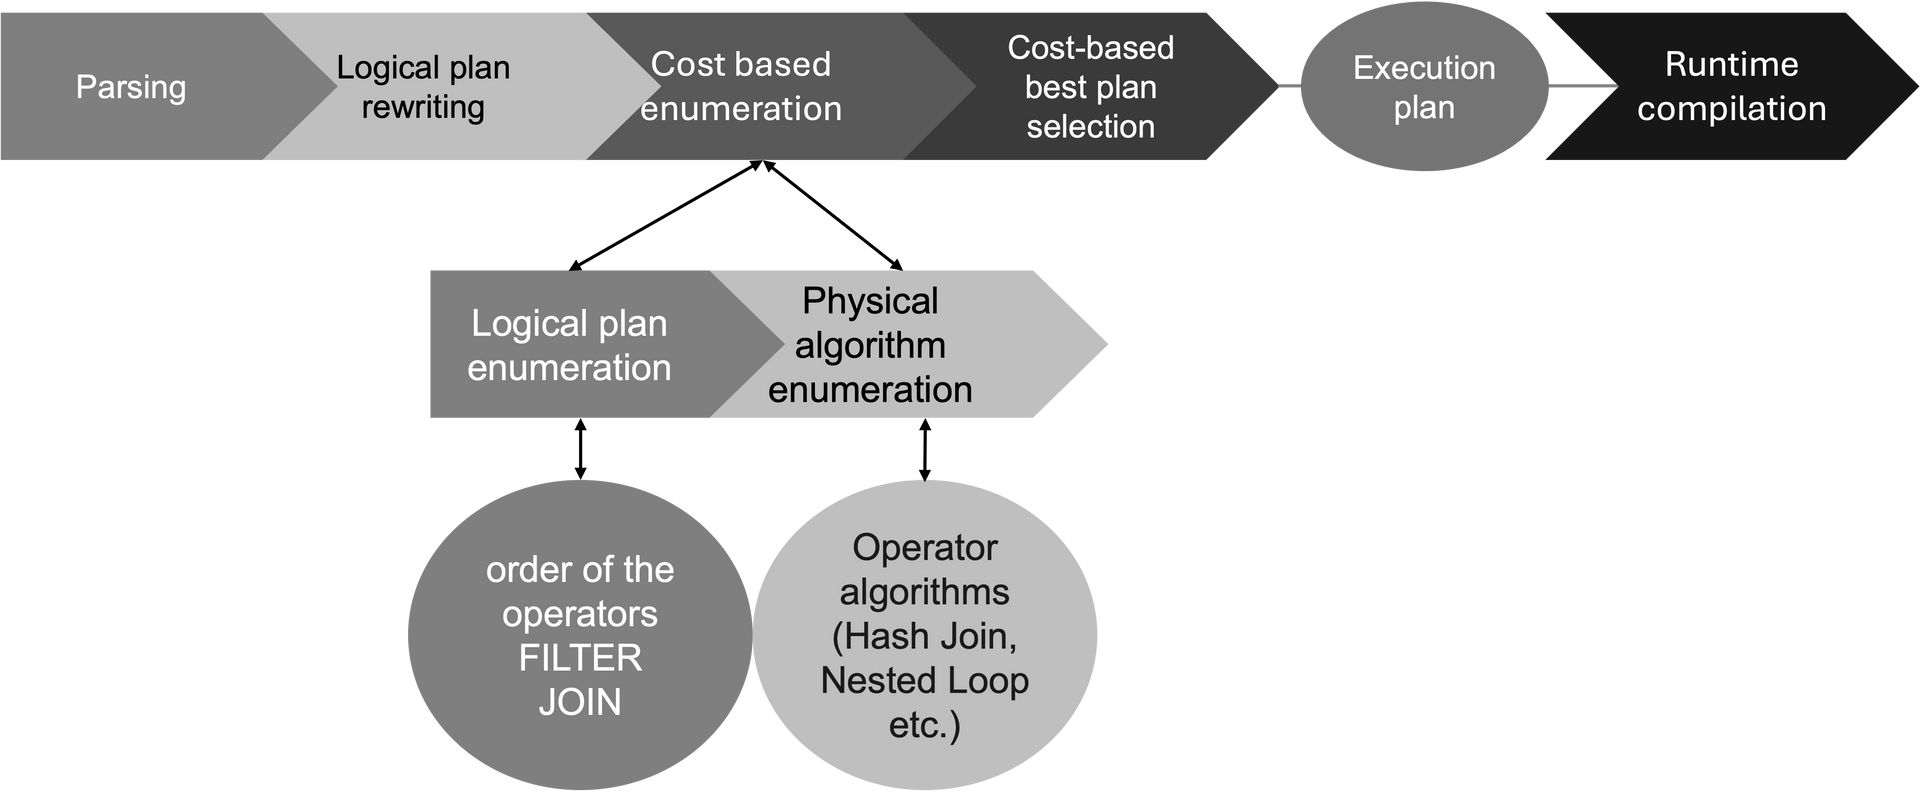
When cost-based enumeration ends, the final query execution plan is generated (called "code generation"). This is the plan that will be executed by the execution engines. At this point, the role of the SQL optimizer also ends.
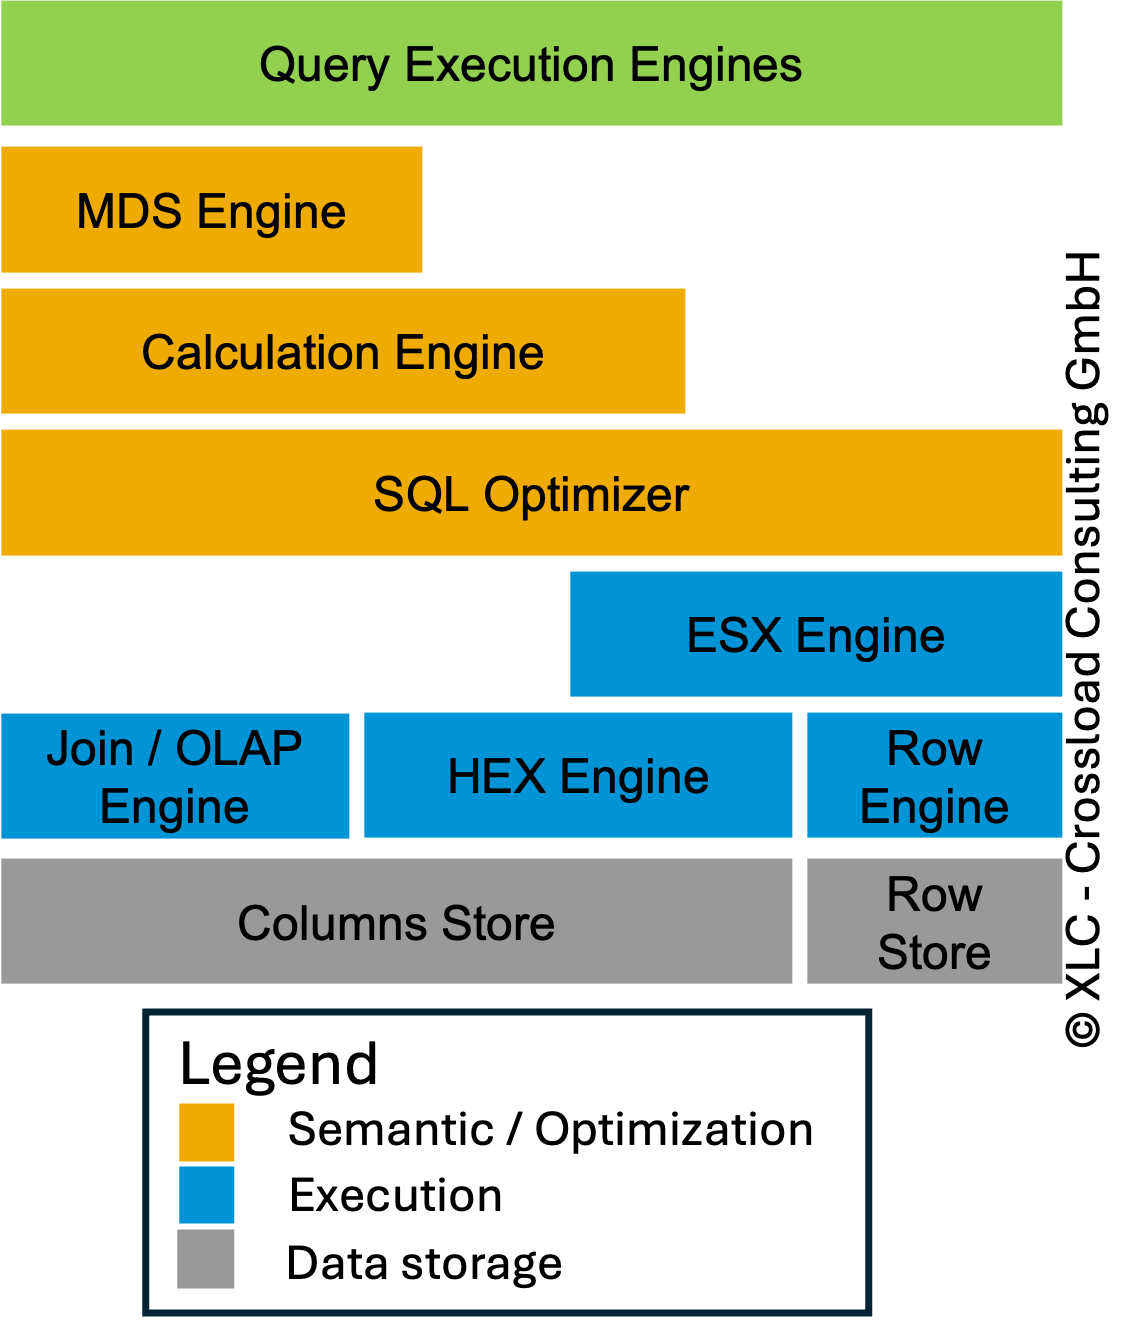
After code generation, the query plan can still be changed but only by the execution engines. This is called "engine-specific optimization" because the changes are determined and made by the execution engines.
Engine-specific decisions vary from engine to engine. An example of an engine-specific decision is the parallel thread decision made by the join engine. During the optimization process, the SQL optimizer does not consider aspects related to memory management and CPU. Its primary task is to make the plan run faster and to do so it uses all available resources to a maximum. Whether the query should run on multiple threads is not part of its decision-making. The join engine is responsible for making this decision. That is why you need to use an engine-specific hint and not an SQL optimizer hint to enforce parallel execution for the query. SAP recommends to implement statement hints in order to avoid performance issues or high resource consumption due to wrong optimizer decisions for some defined standard SQLs (2700051 - Delivery of SAP HANA Statement Hints). This hints will be updated from time to time. Our recommendation is to add this note to your favorite notes and track changes (recent change of the note: 05/25/2025).
SAP HANA News by XLC